Implement Network Monitoring: A Step-by-Step Technical Guide
Build a monitoring stack that catches anomalies without drowning you in noise, using standard protocols and strict alert filtering from day one.

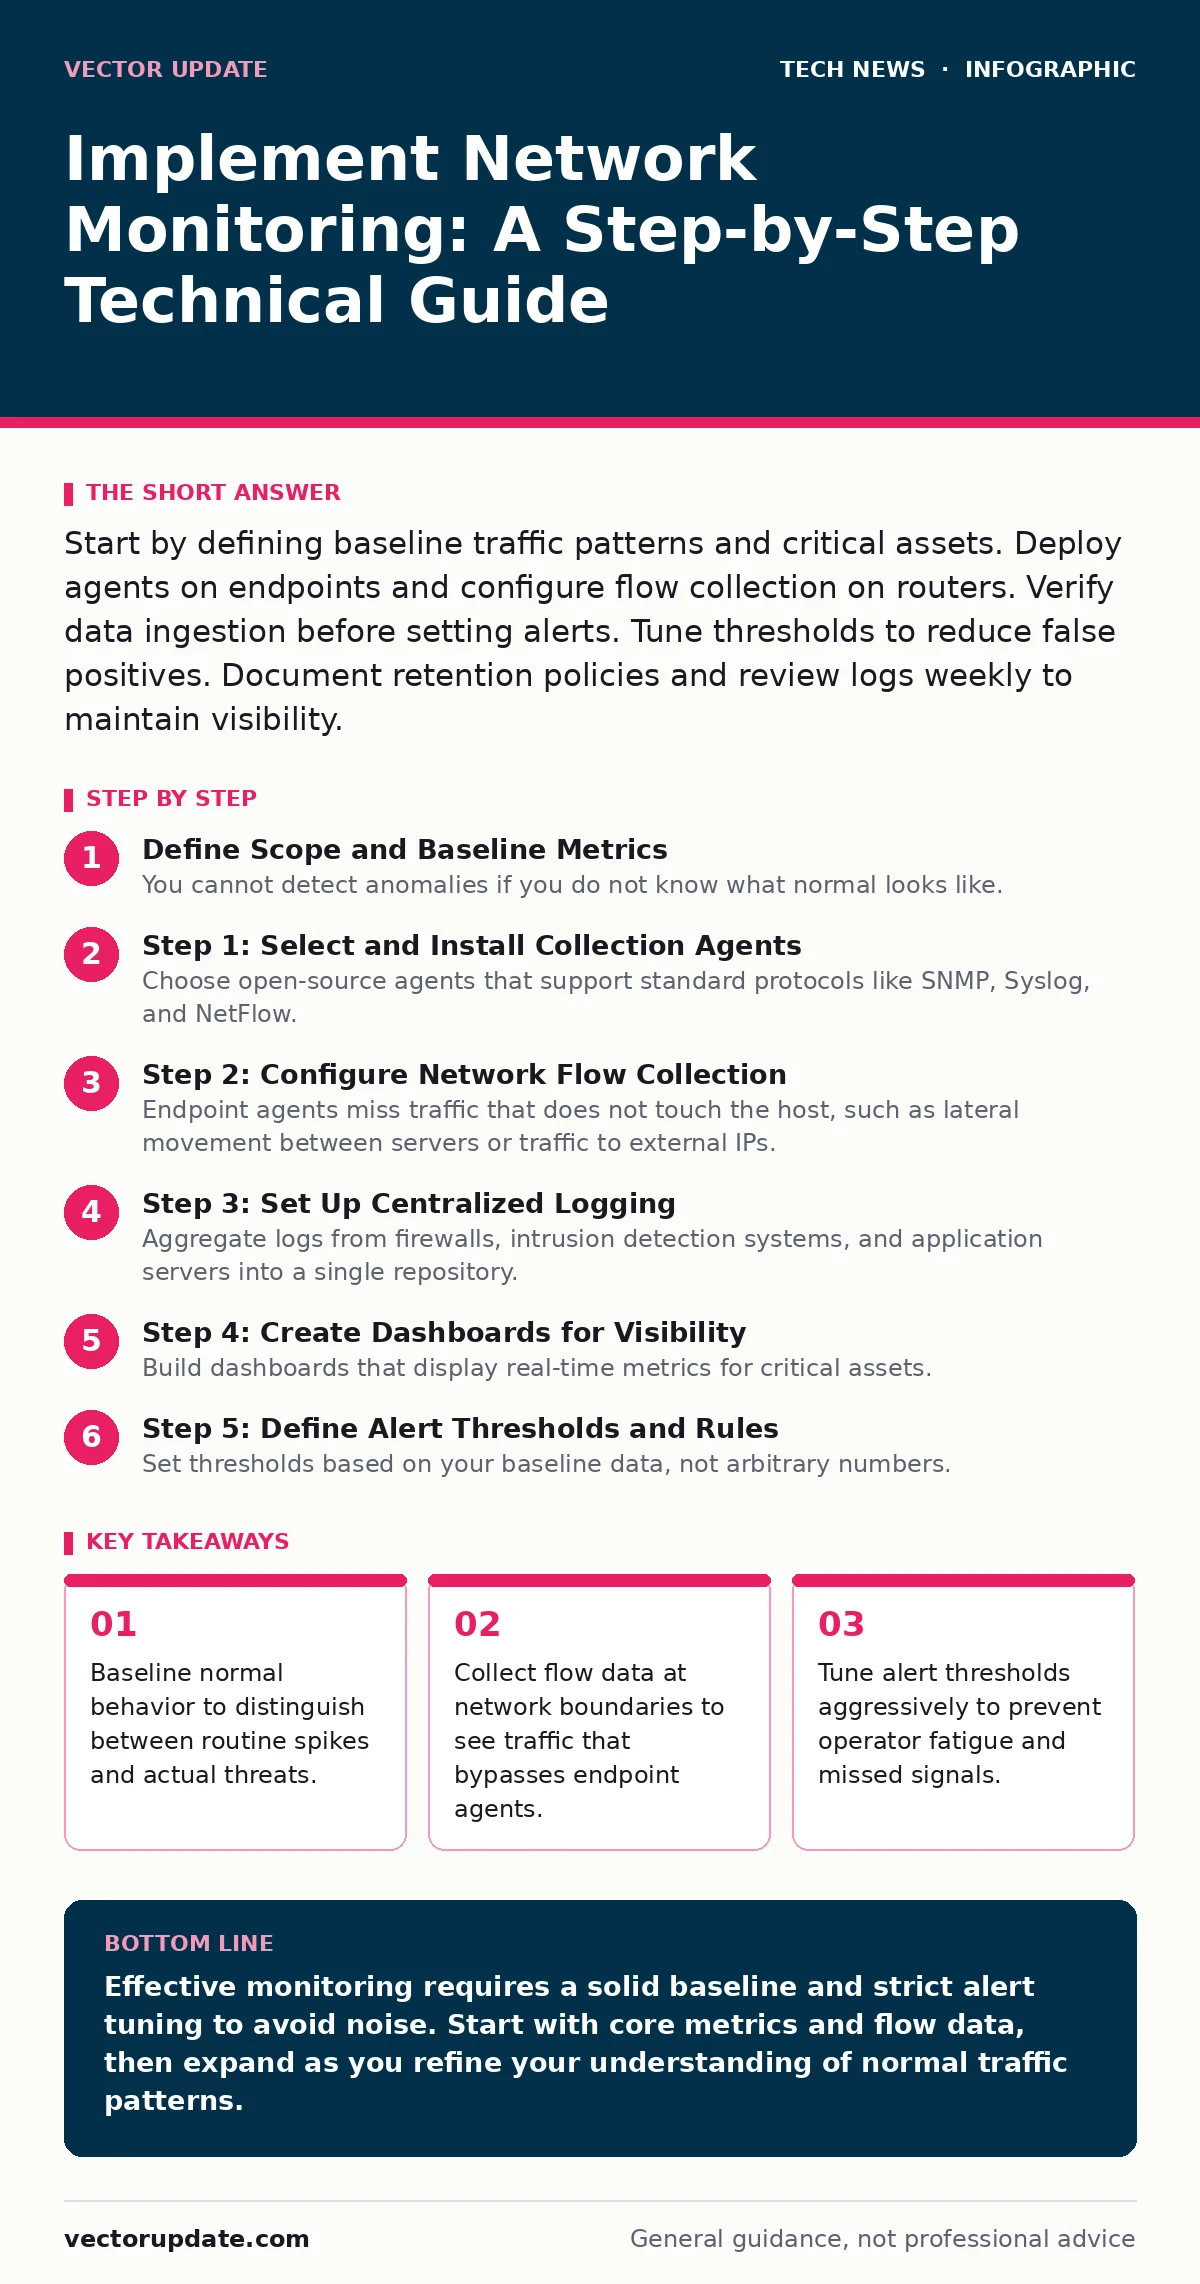
Start by defining baseline traffic patterns and critical assets. Deploy agents on endpoints and configure flow collection on routers. Verify data ingestion before setting alerts. Tune thresholds to reduce false positives. Document retention policies and review logs weekly to maintain visibility.
Define Scope and Baseline Metrics
You cannot detect anomalies if you do not know what normal looks like. Before installing any software, map your critical assets and document their expected behavior. This includes web servers, database clusters, and internal DNS resolvers. Identify which metrics matter for each asset, such as CPU load, memory usage, or packet loss rates.
Establish a baseline by observing traffic over a representative period. Note peak hours, typical bandwidth consumption, and standard latency levels. This data becomes your reference point for all future alerts. Without it, every spike looks like an attack, and every dip looks like a failure.
Step 1: Select and Install Collection Agents
Choose open-source agents that support standard protocols like SNMP, Syslog, and NetFlow. Install these agents on every server and critical endpoint. Ensure the agents have the necessary permissions to read system metrics and network interfaces. Configure them to send data to a central collector rather than storing logs locally.
Verify installation by checking the agent status on a sample of hosts. Confirm that the central collector receives data streams from these agents. Look for consistent timestamps and complete metric sets. If data is missing, check firewall rules that might block outbound traffic from the agents.
Step 2: Configure Network Flow Collection
Endpoint agents miss traffic that does not touch the host, such as lateral movement between servers or traffic to external IPs. Configure your routers and switches to export flow data to your collector. This provides a view of all traffic passing through network boundaries. Use NetFlow, sFlow, or IPFIX standards for this purpose.
Enable flow export on core switches and edge routers. Point the export destination to your monitoring server. Verify that the collector is receiving flow records by checking the input queue length. Ensure the data includes source and destination IPs, ports, and protocol types.
Step 3: Set Up Centralized Logging
Aggregate logs from firewalls, intrusion detection systems, and application servers into a single repository. Use a standardized format like JSON for easier parsing and analysis. Configure log rotation and retention policies to manage storage costs. Define clear naming conventions for log sources to simplify filtering.
Check that logs from diverse sources appear in the central repository. Search for recent events from different systems to confirm integration. Ensure timestamps are synchronized across all devices using NTP. Desynchronized time makes correlating events across systems nearly impossible.
Step 4: Create Dashboards for Visibility
Build dashboards that display real-time metrics for critical assets. Group related metrics together, such as CPU, memory, and disk I/O for a specific server. Use visualizations that highlight trends and outliers, such as line graphs for bandwidth and bar charts for error rates. Keep dashboards simple and focused on actionable information.
Validate dashboards by comparing displayed data with raw logs. Ensure that the metrics match the expected values from your baseline. Check that alerts trigger correctly when thresholds are exceeded. Avoid cluttering the dashboard with too many widgets, which obscures important trends.
See also: How AI Security Operations Work: Mechanisms, Limits, and Blind Spots
Step 5: Define Alert Thresholds and Rules
Set thresholds based on your baseline data, not arbitrary numbers. Use dynamic thresholds that adjust for time of day or day of the week. Create rules that correlate multiple events, such as a spike in failed logins followed by a successful login from a new IP. Avoid alerting on every single event to prevent noise.
Test alerts by simulating known conditions, such as high CPU usage or a port scan. Verify that the correct notifications are sent to the right team members. Review the alert frequency to ensure it is manageable. Too many alerts lead to alert fatigue, where operators ignore critical warnings.
Step 6: Validate End-to-End Data Flow
Perform a comprehensive test of the entire monitoring stack. Generate synthetic traffic that mimics normal and abnormal patterns. Confirm that agents collect the data, flow exporters send it, and logs are aggregated. Check that dashboards update in real-time and alerts fire as expected.
Document any gaps or delays in the data pipeline. Address these issues before relying on the system for security operations. Ensure that historical data is stored and searchable for forensic analysis. Verify that users have appropriate access controls to view sensitive metrics.
Verification Checklist
Use this list to confirm your monitoring implementation is functional.
- Agents are installed and reporting on all critical servers.
- Flow data is being exported from core network devices.
- Logs from firewalls and IDS are aggregated in the central repository.
- Dashboards display accurate, real-time metrics.
- Alerts trigger correctly for simulated anomalies.
- Historical data is searchable and retained per policy.
- Access controls restrict sensitive data to authorized personnel.
Maintain and Tune the System
Monitoring is not a set-and-forget task. Review alerts weekly to identify false positives and adjust thresholds. Update agent software regularly to fix bugs and support new metrics. Re-baseline your metrics when significant changes occur, such as new deployments or traffic pattern shifts.
Audit log retention policies to ensure compliance with legal and operational requirements. Archive old data to cheaper storage if necessary. Train your team on how to interpret dashboards and respond to alerts. Regular maintenance ensures your monitoring remains effective over time.
Key takeaways
- Baseline normal behavior to distinguish between routine spikes and actual threats.
- Collect flow data at network boundaries to see traffic that bypasses endpoint agents.
- Tune alert thresholds aggressively to prevent operator fatigue and missed signals.
Effective monitoring requires a solid baseline and strict alert tuning to avoid noise. Start with core metrics and flow data, then expand as you refine your understanding of normal traffic patterns.
Frequently asked questions
How do I reduce false positive alerts?
Adjust thresholds based on historical baseline data and use dynamic rules that account for time-based variations in traffic.
What is the difference between SNMP and NetFlow?
SNMP monitors device health and status, while NetFlow provides detailed records of traffic flows passing through network interfaces.
How often should I update monitoring software?
Apply updates regularly to patch security vulnerabilities and gain access to new features and protocol support.
Can I monitor cloud resources with the same tools?
Yes, most open-source agents and collectors support cloud APIs and can integrate with cloud-native logging and metrics services.
How this guide was produced: written by the Vector Update editorial team with AI assistance, checked against the public references listed below, and reviewed when the facts change. See our editorial policy or report an error.